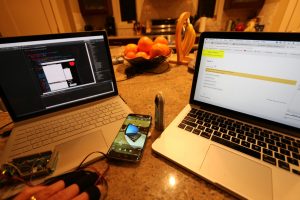
Hi, we are once again exploring how a variety of tools can be brought together to track activity metrics across learning platforms.
For this particular demo, we are combining several data streams. We ask participants to try a challenging series of 20 case vignettes, representing the routine morning task of going through lab results. You have limited time to make a decision on each vignette.
If you want to try the Rushing Roulette scenario yourself, you launch it on our demo OpenLabyrinth server here: http://demo.openlabyrinth.ca/renderLabyrinth/index/727
…or you can view it embedded here at the bottom of this page.
In the original Rushing Roulette scenario, we gave our participants 30 seconds per vignette to decide. For the stress test, we made things much harder, starting at 25 seconds, and knocking off 1 second per case so that for the last vignette, you only have 6 seconds to act. If you do not act in time, you are automatically moved on to the next case.
Now, this can be a wee bit stressful. We wanted to measure just how stressed our participants might be. For this we constructed a simple device, based on a $30 Arduino board, which kinda acts like a lie detector. It measures heart rate and galvanic skin response (how sweaty you get!).

We created this fish-eye 360 degree view of this setup in action so that you can get a sense of what is happening. Using the 360 view control in the video below, scroll right to see the vignettes; scroll left to see the Arduino sensor output.
In our testing so far, this cheap $30 Arduino-based lie-detector has been remarkably sensitive. Take a look at one of our early beta testers running the Rushing Roulette scenario.
All of the activity streams from this small program evaluation are collected into a Learning Records Store (LRS), using the Experience API (xAPI). This allows us to compare activity metrics from a wide variety of sources, during these workshop demos.
We have previously demonstrated this technique at other workshops, such as CHES at UBC:
